Inter-annotator Agreements for All Participants
Inter-annotator agreement results for the 12th repetition of the NR condition recordings (NR12) visualised over different tolerance windows (20-100 ms) for viola, cello, and first and second violin (VA, VC, VN1 and V2). For more details please refer to Experiment 1 in the paper.
Viola - 24 Annotators
Pairwise agreements between 24 annotators using F-measure score sorted by years of musical experience.
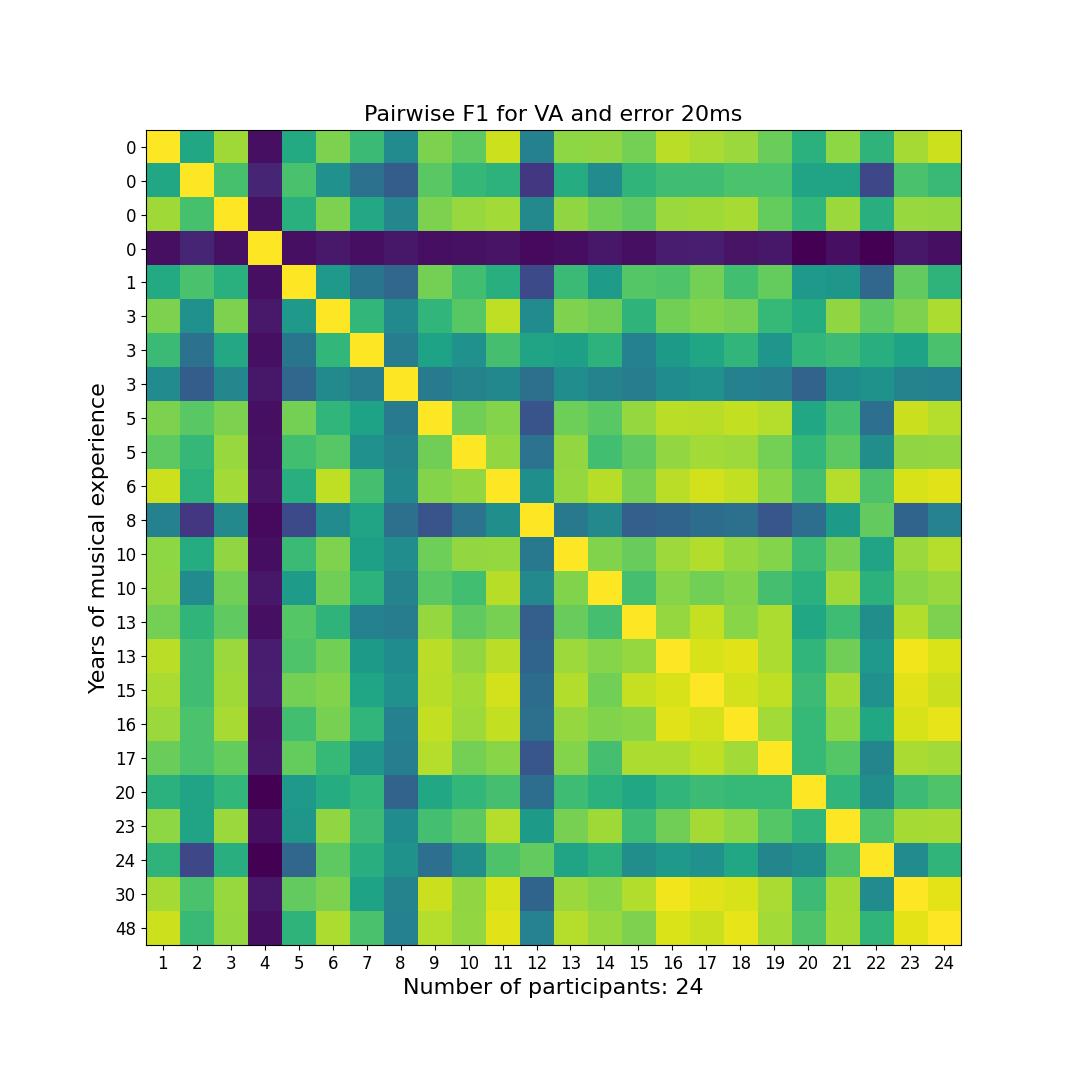
20ms Tolerance Window
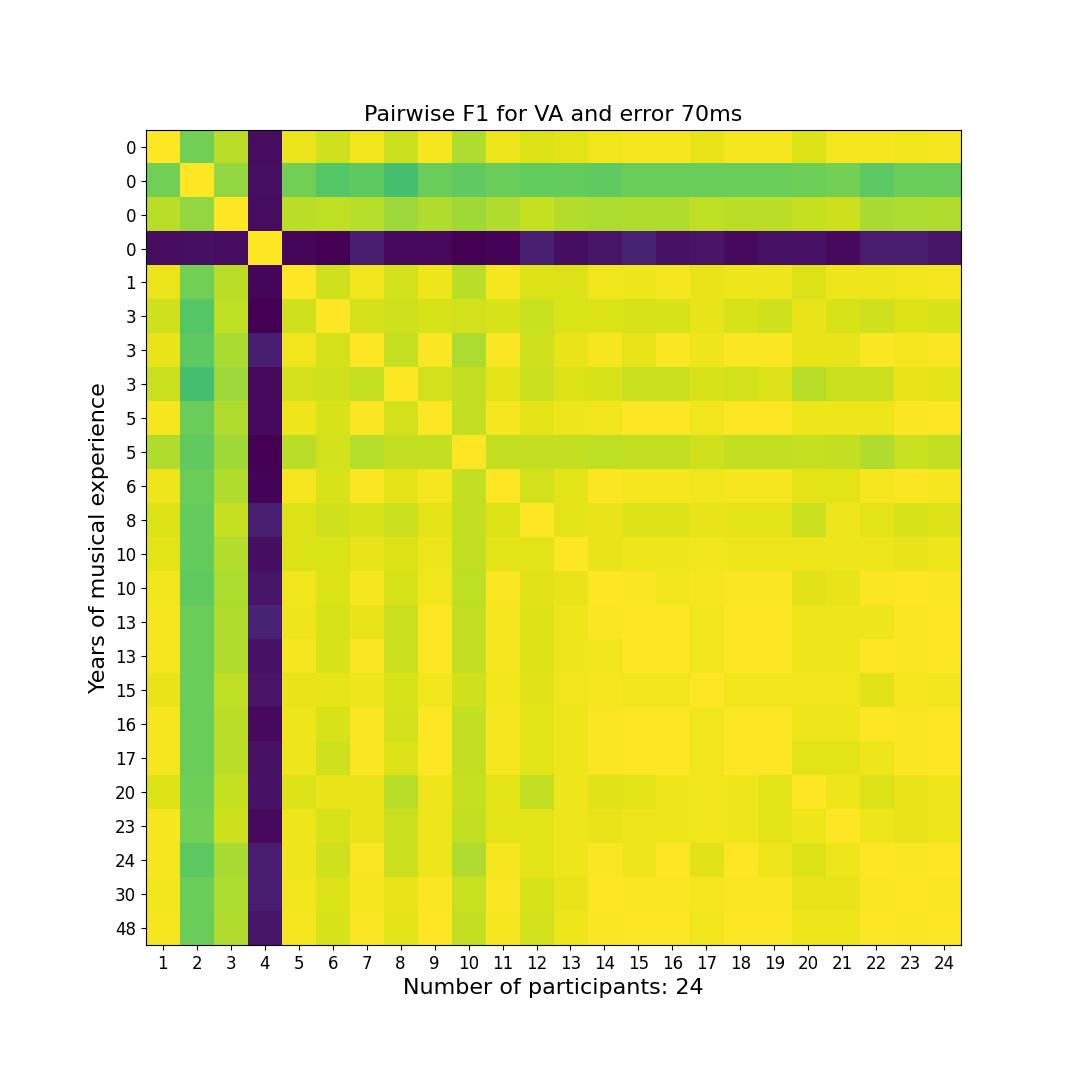
70ms Tolerance Window
Cello - 24 Annotators
Pairwise agreements between 24 annotators using F-measure score sorted by years of musical experience.
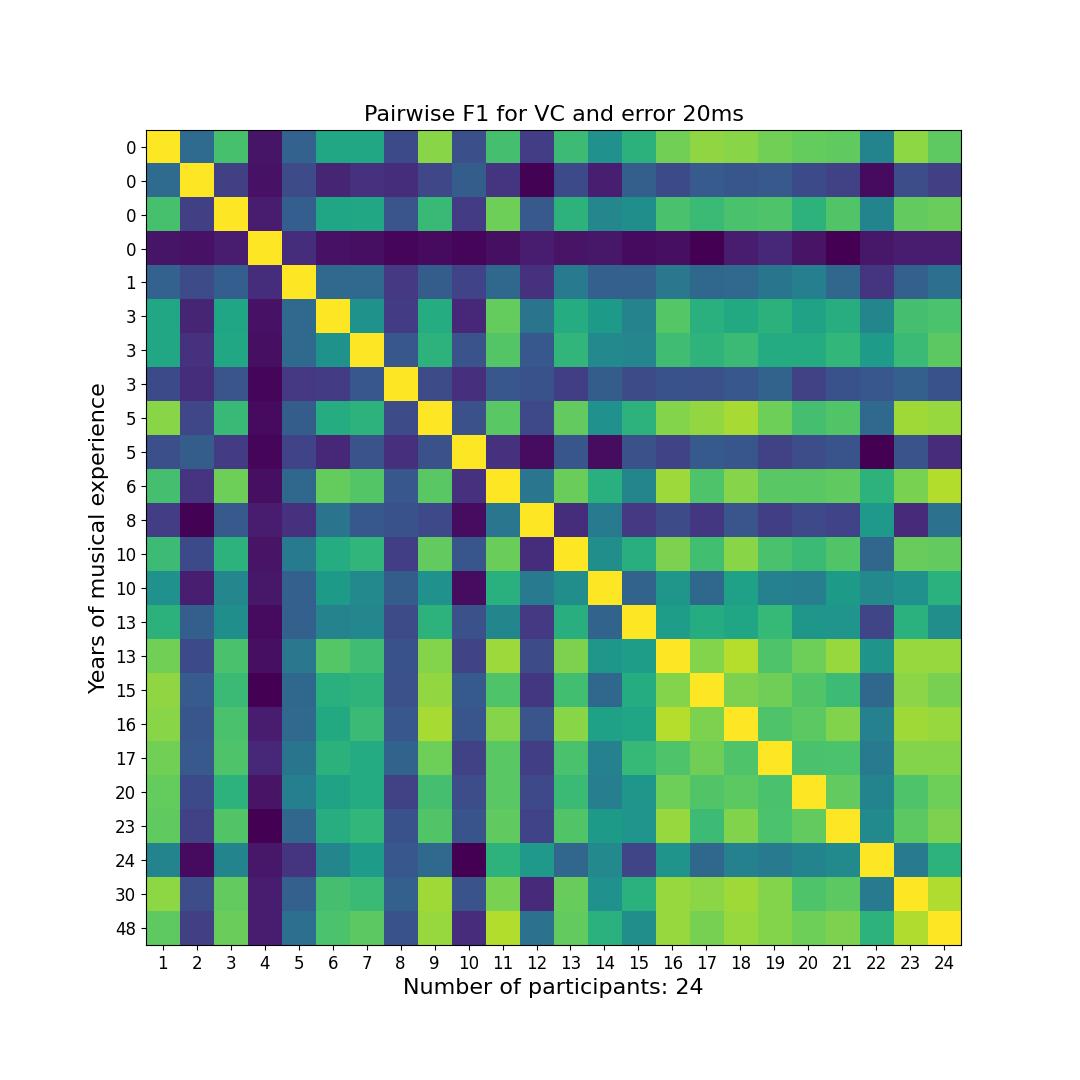
20ms Tolerance Window

70ms Tolerance Window
First Violin - 24 Annotators
Pairwise agreements between 24 annotators using F-measure score sorted by years of musical experience.
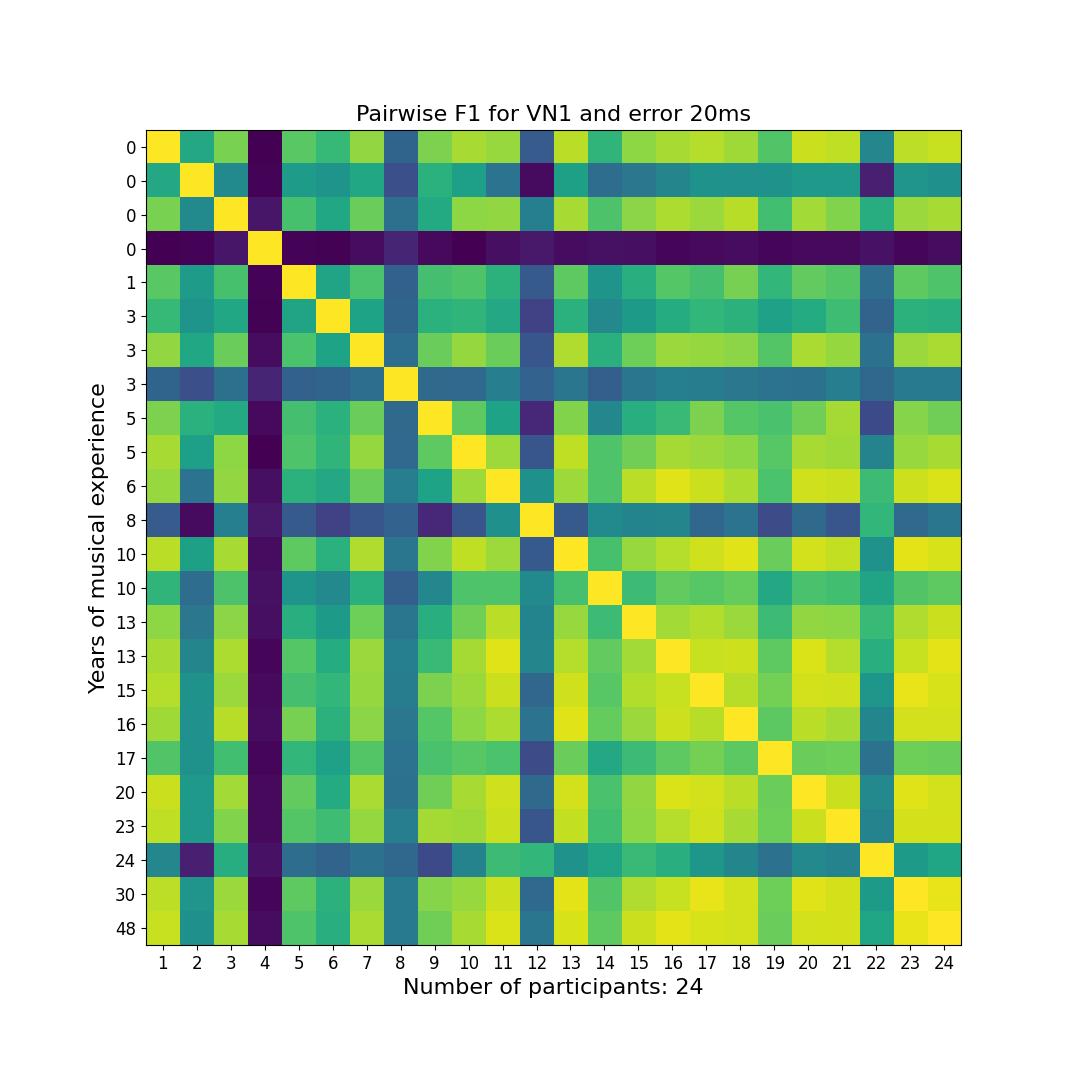
20ms Tolerance Window

70ms Tolerance Window
Second Violin - 24 Annotators
Pairwise agreements between 24 annotators using F-measure score sorted by years of musical experience.
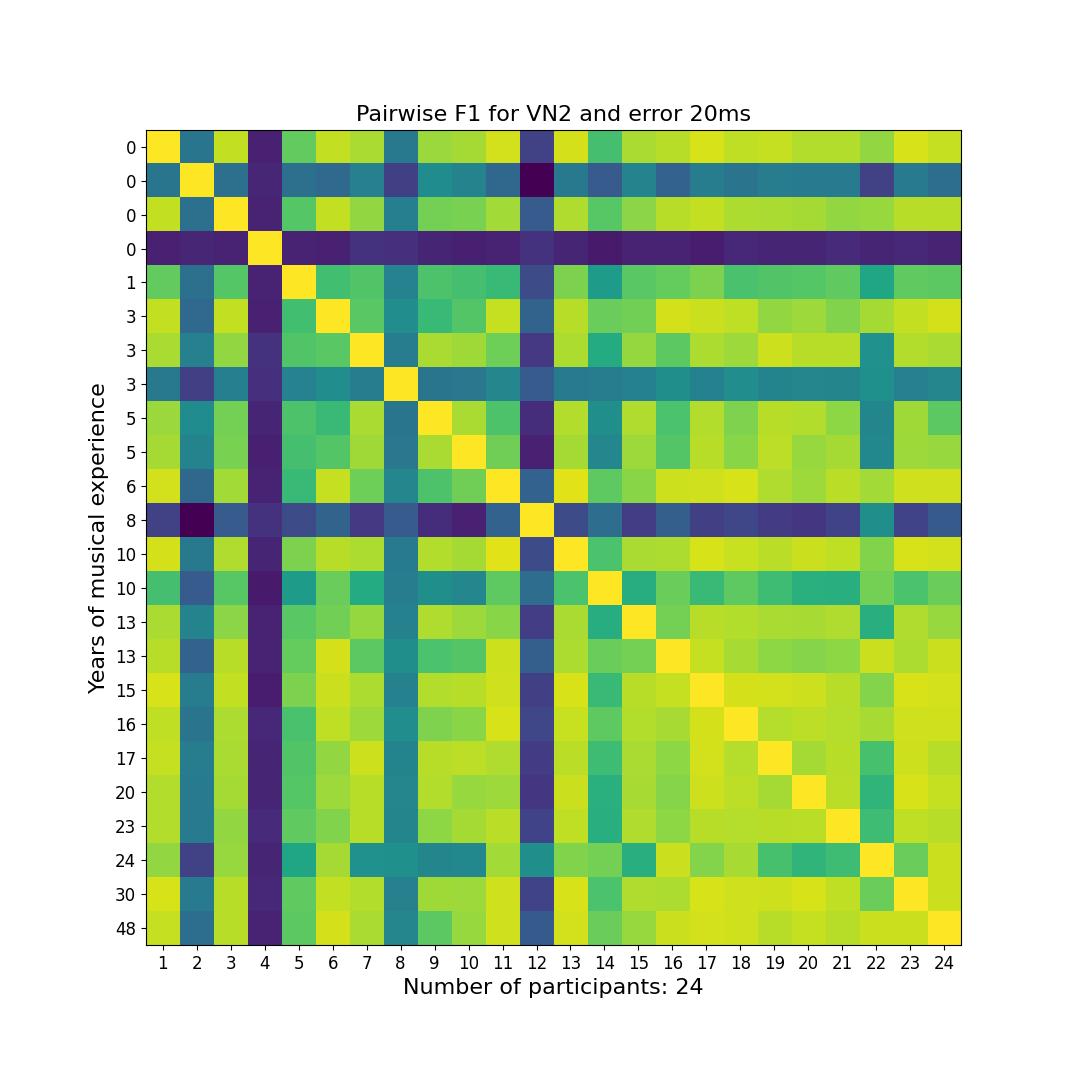
20ms Tolerance Window
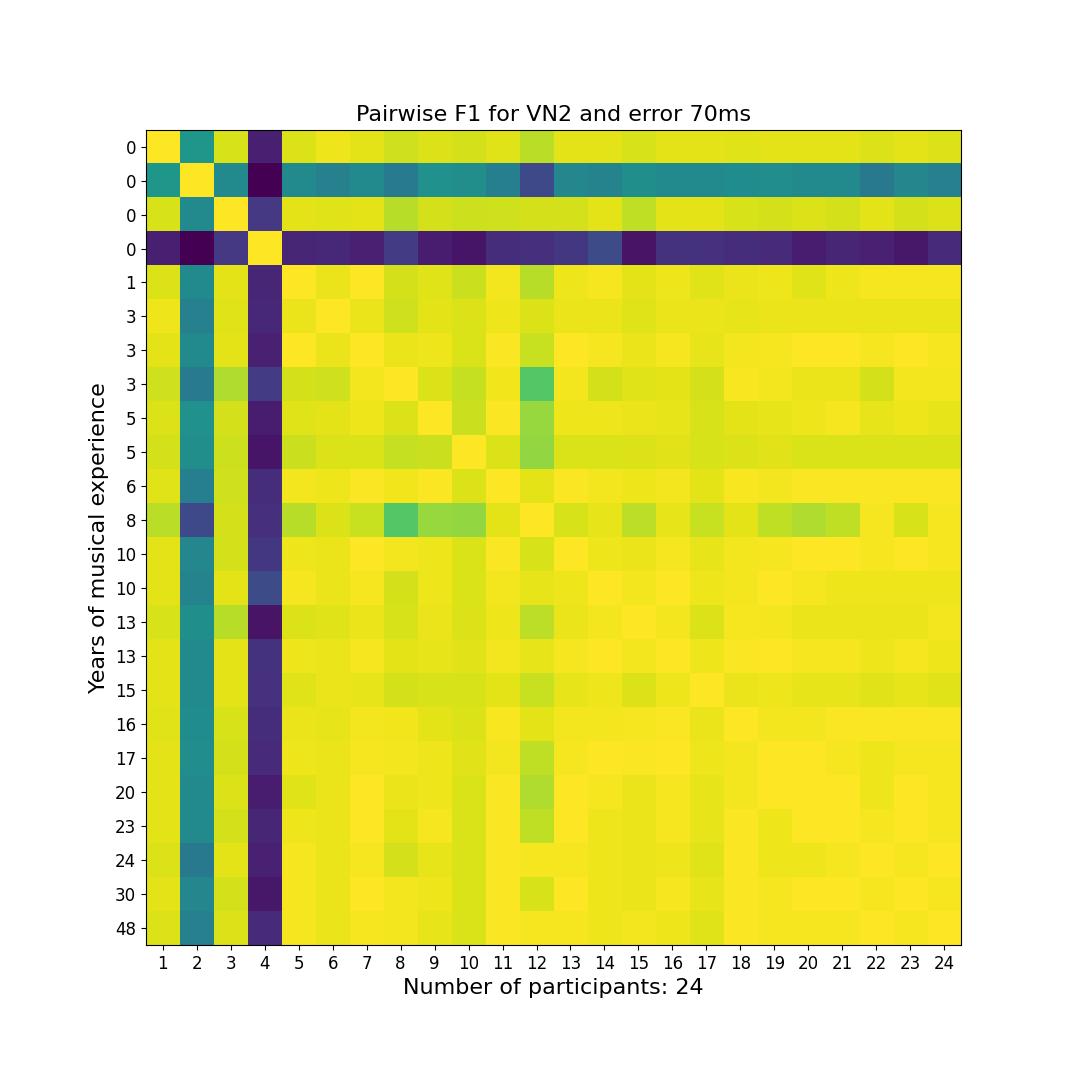
70ms Tolerance Window
Inter-annotator Agreements for a Subset of Participants
Viola - 16 Annotators
Pairwise F-measure agreements between 16 annotators with 5 or more years of musical experience.
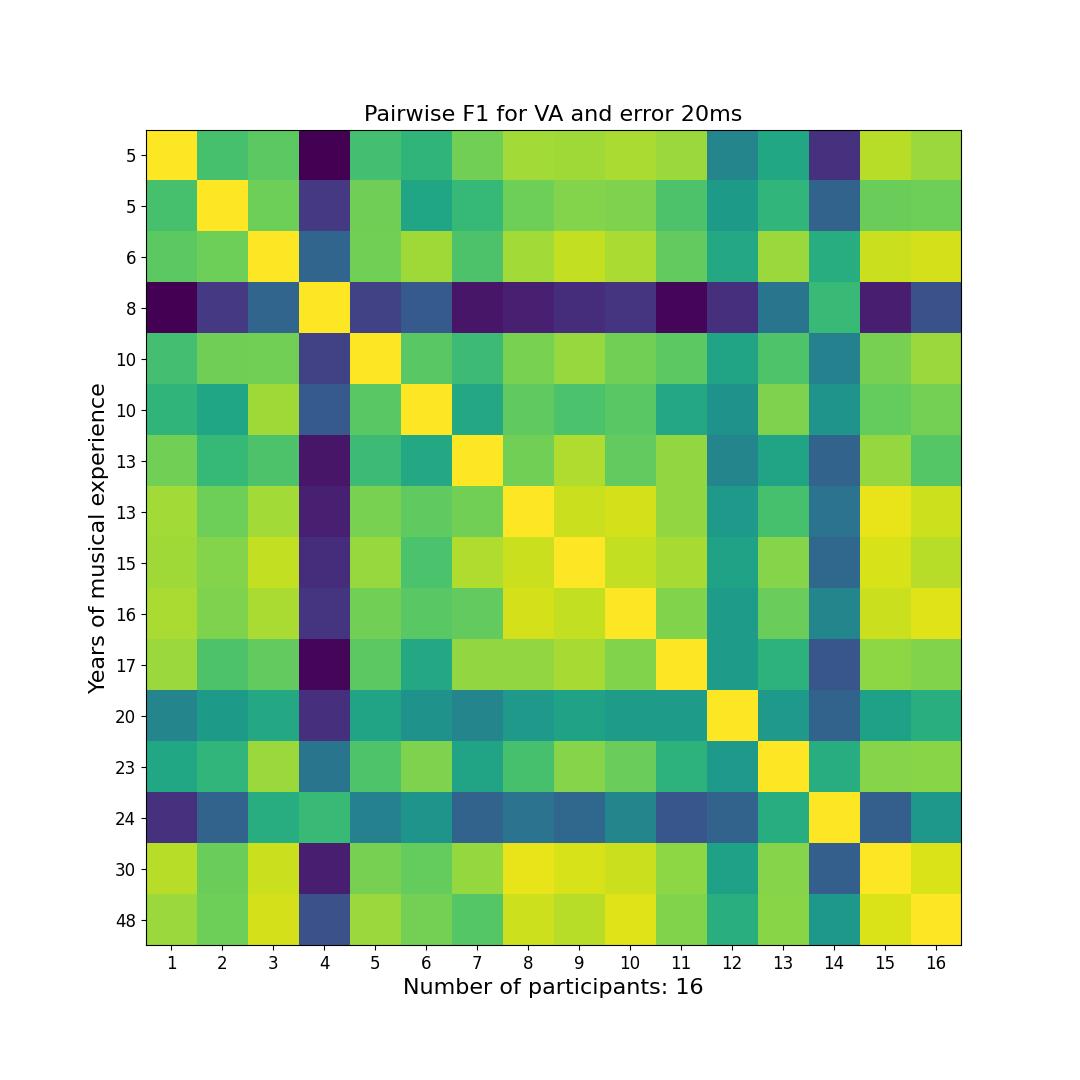
20ms Tolerance Window
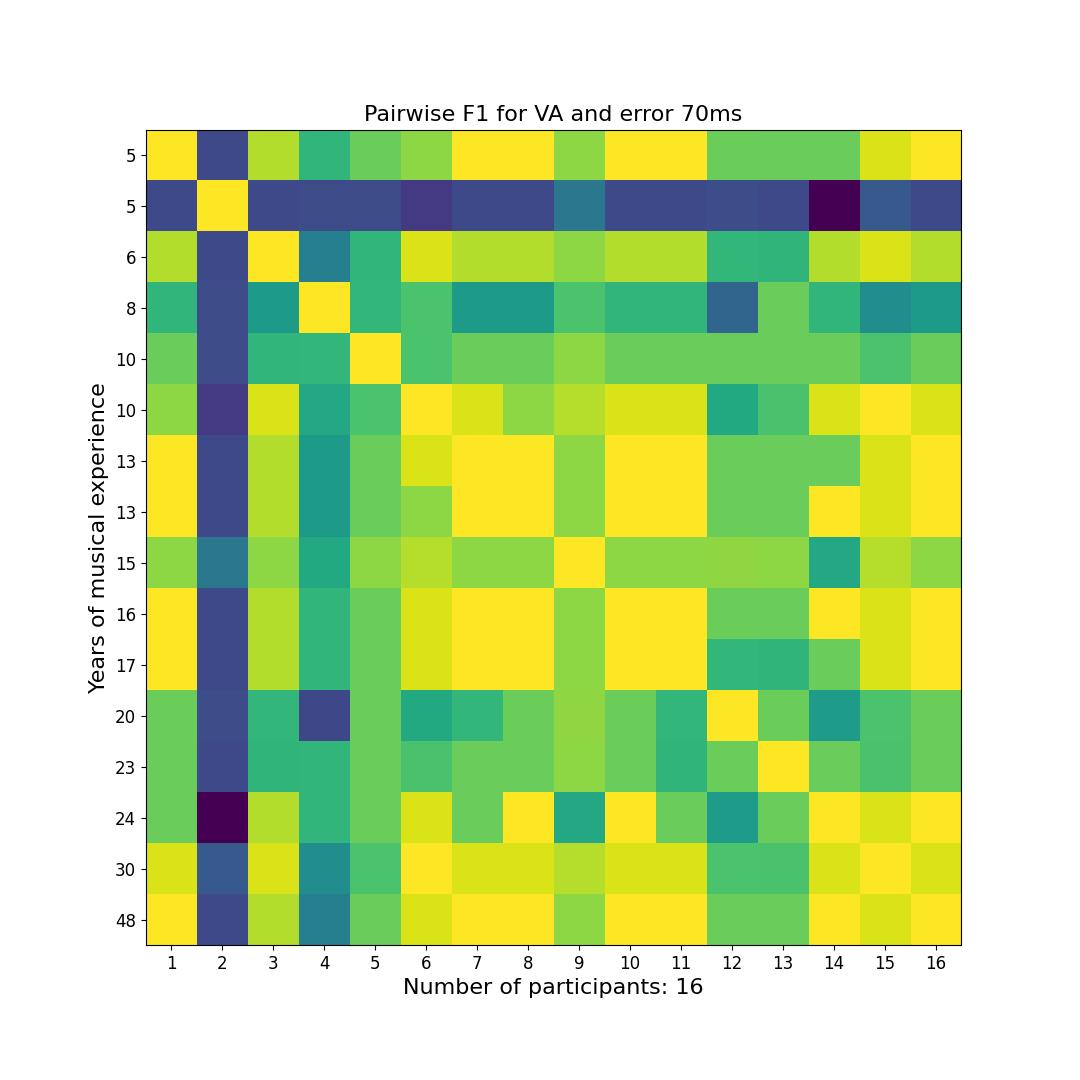
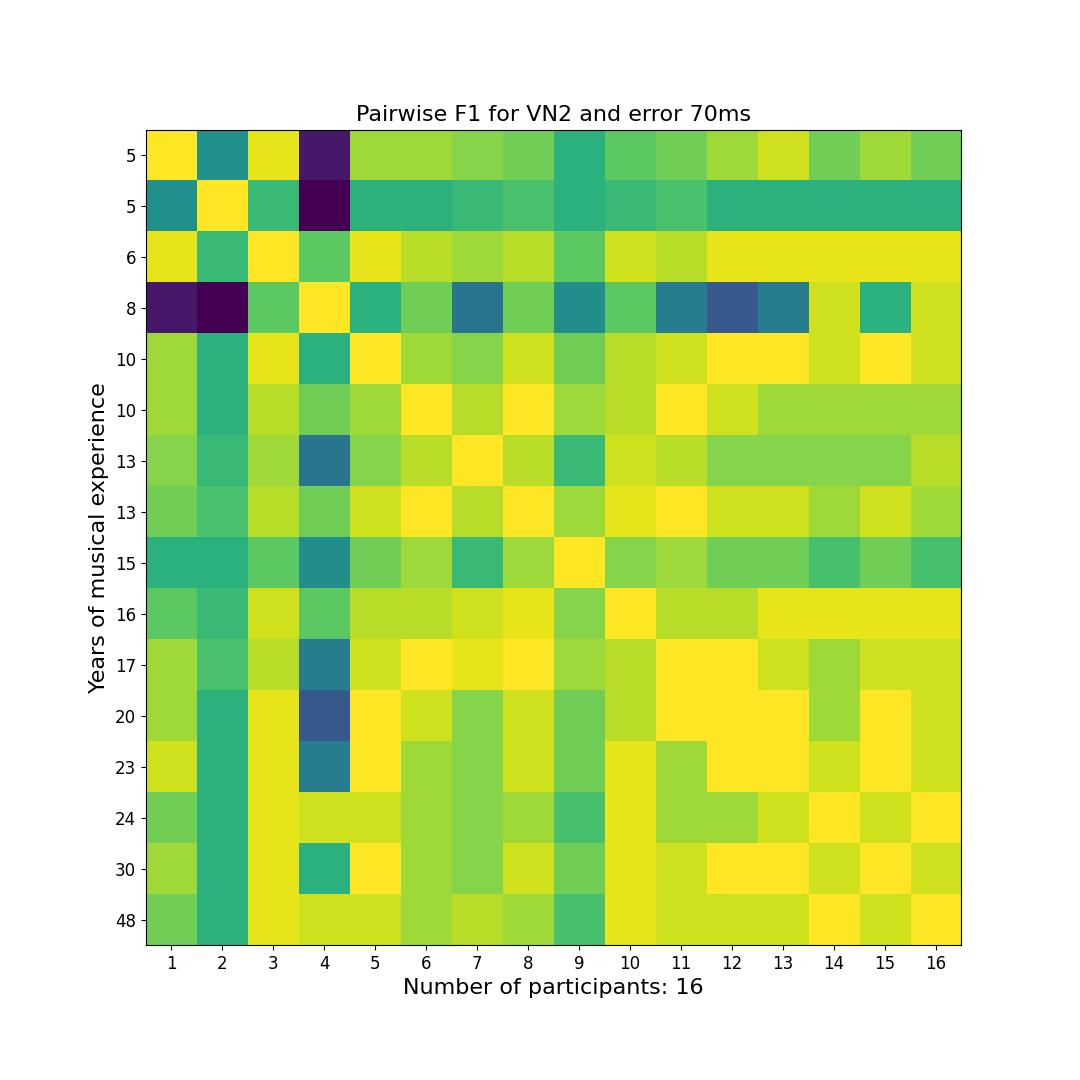
70ms Tolerance Window
Cello - 16 Annotators
Pairwise F-measure agreements between 16 annotators with 5 or more years of musical experience.
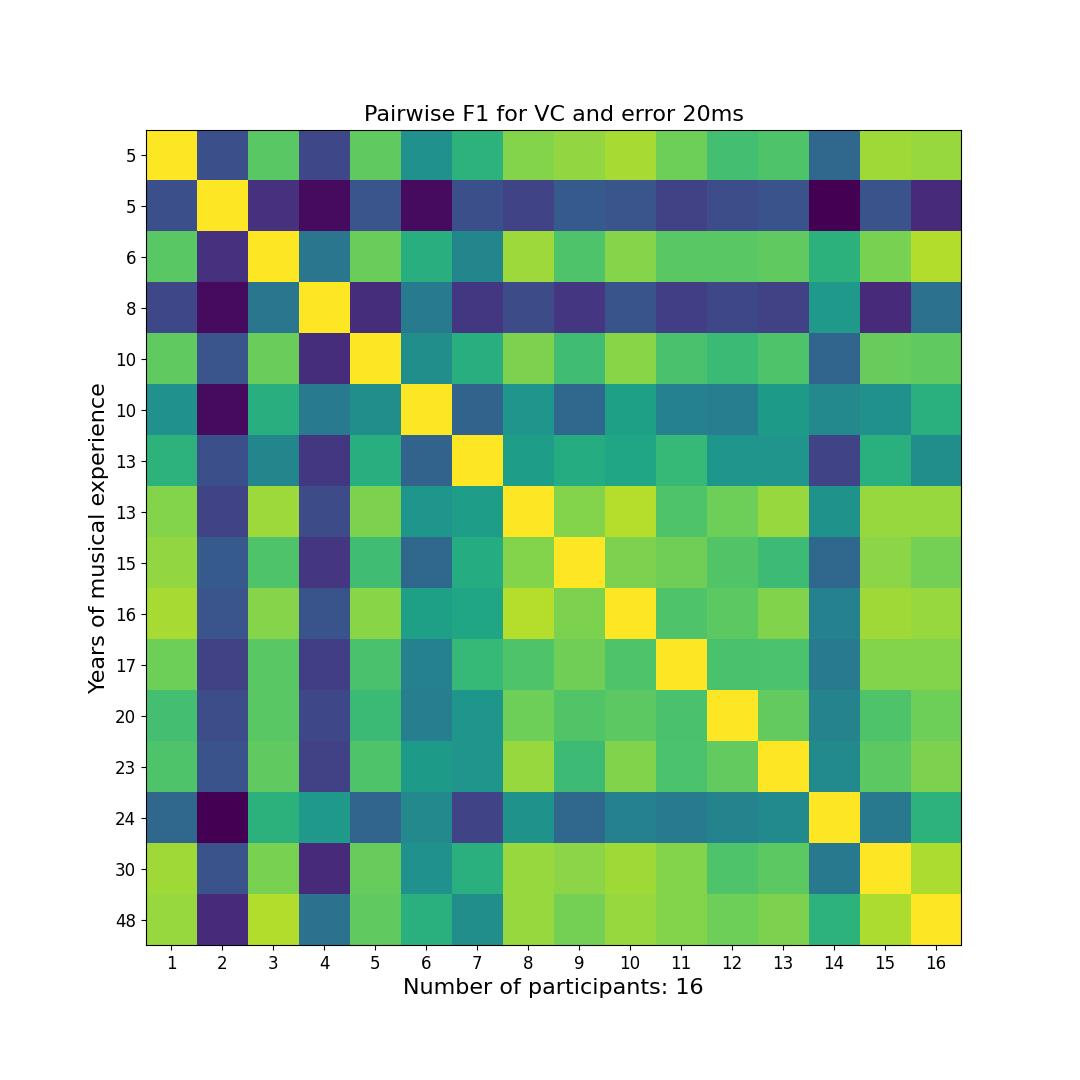
20ms Tolerance Window

70ms Tolerance Window
First Violin - 16 Annotators
Pairwise F-measure agreements between 16 annotators with 5 or more years of musical experience.
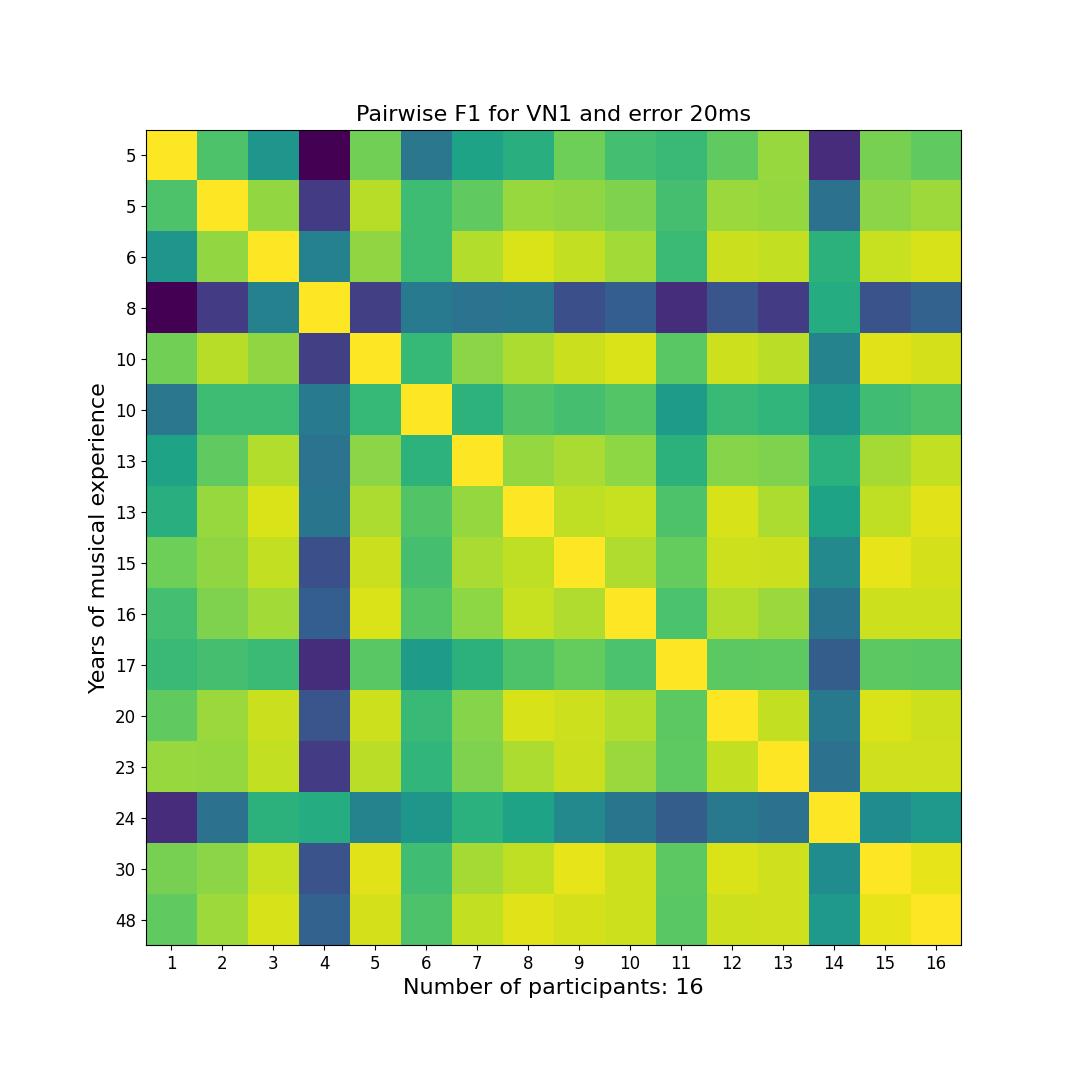
20ms Tolerance Window
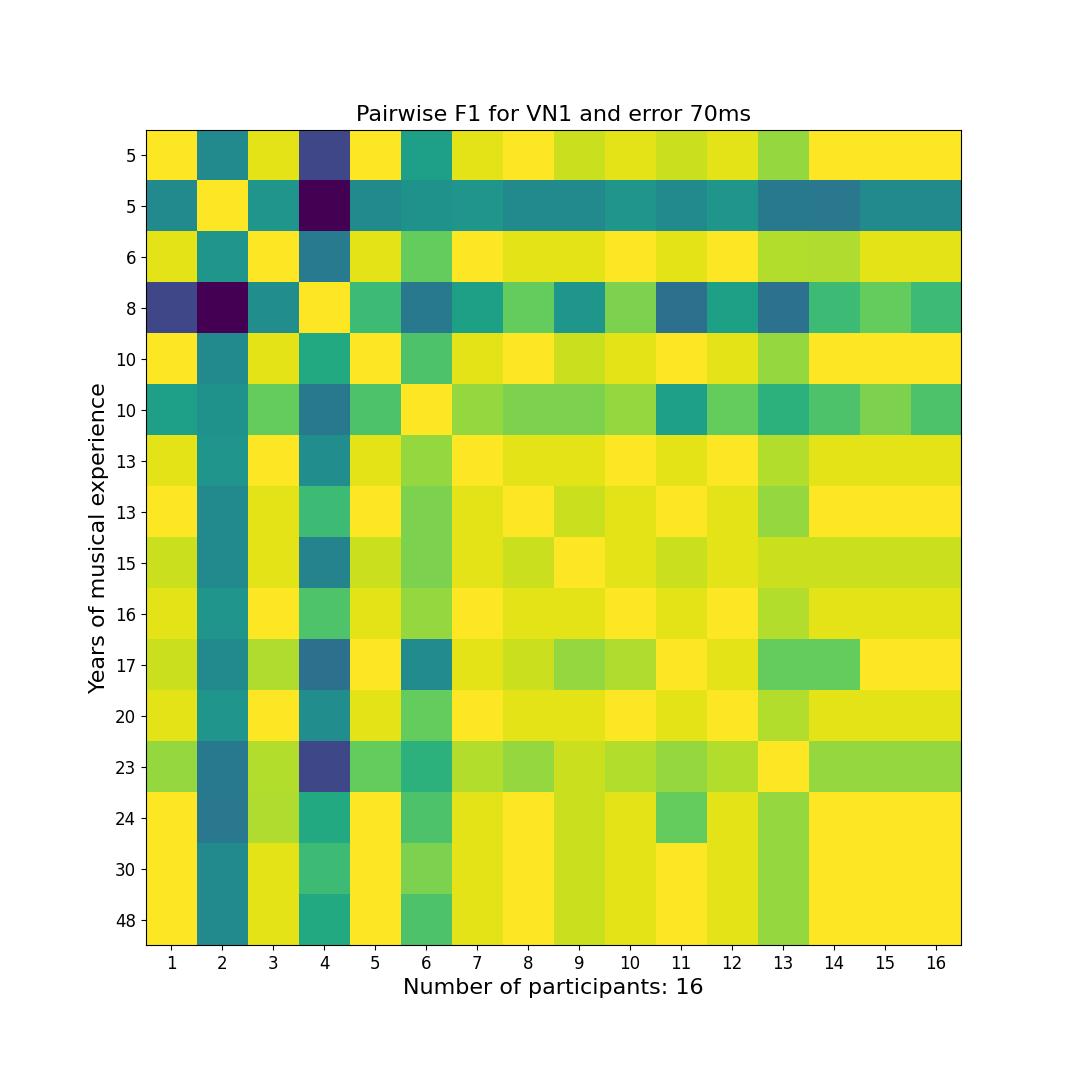
70ms Tolerance Window
Second Violin - 16 Annotators
Pairwise agreements between 24 annotators using F-measure score sorted by years of musical experience.
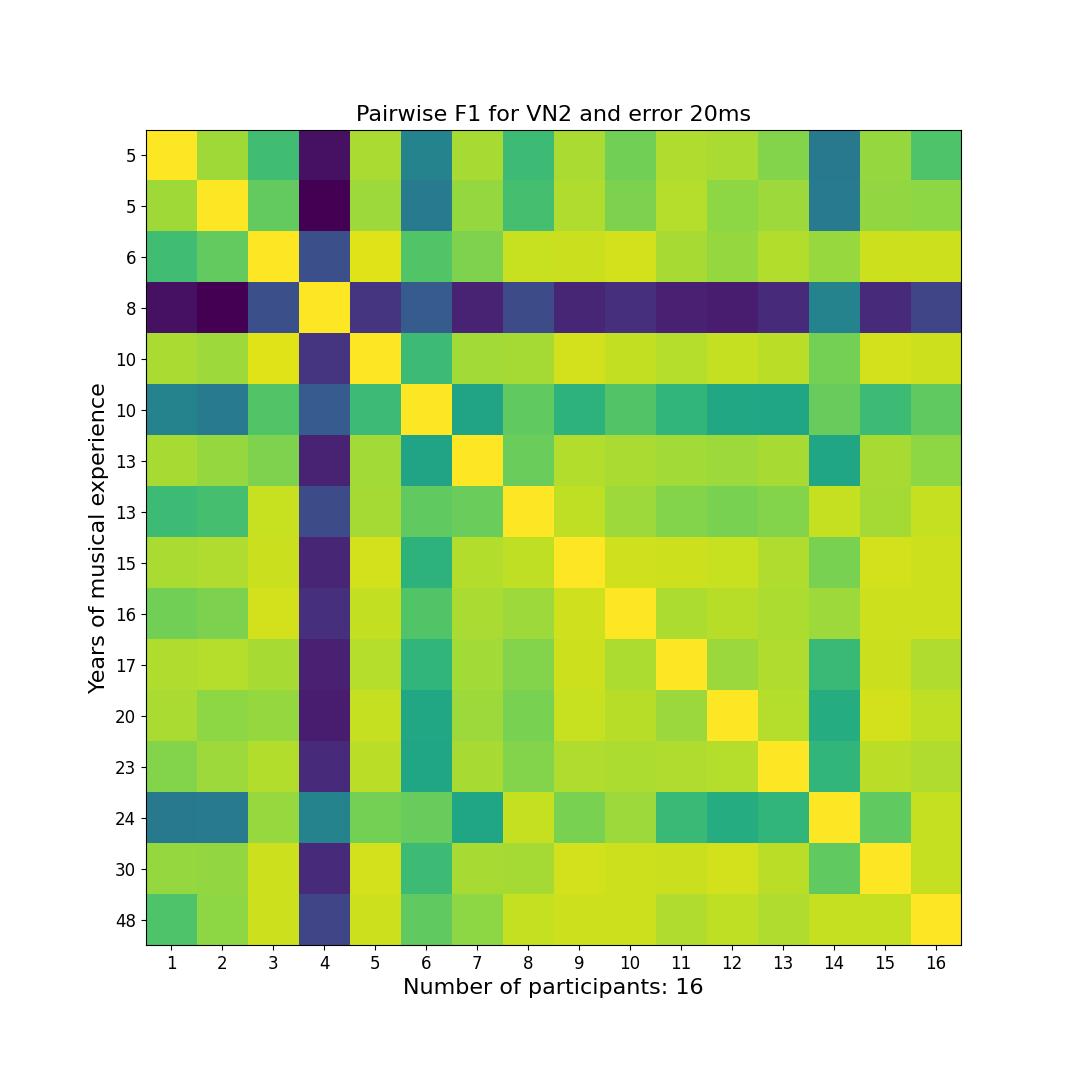
20ms Tolerance Window
70ms Tolerance Window
Inter-annotator Performance
For more details please refer to Experiment 2 in the paper.
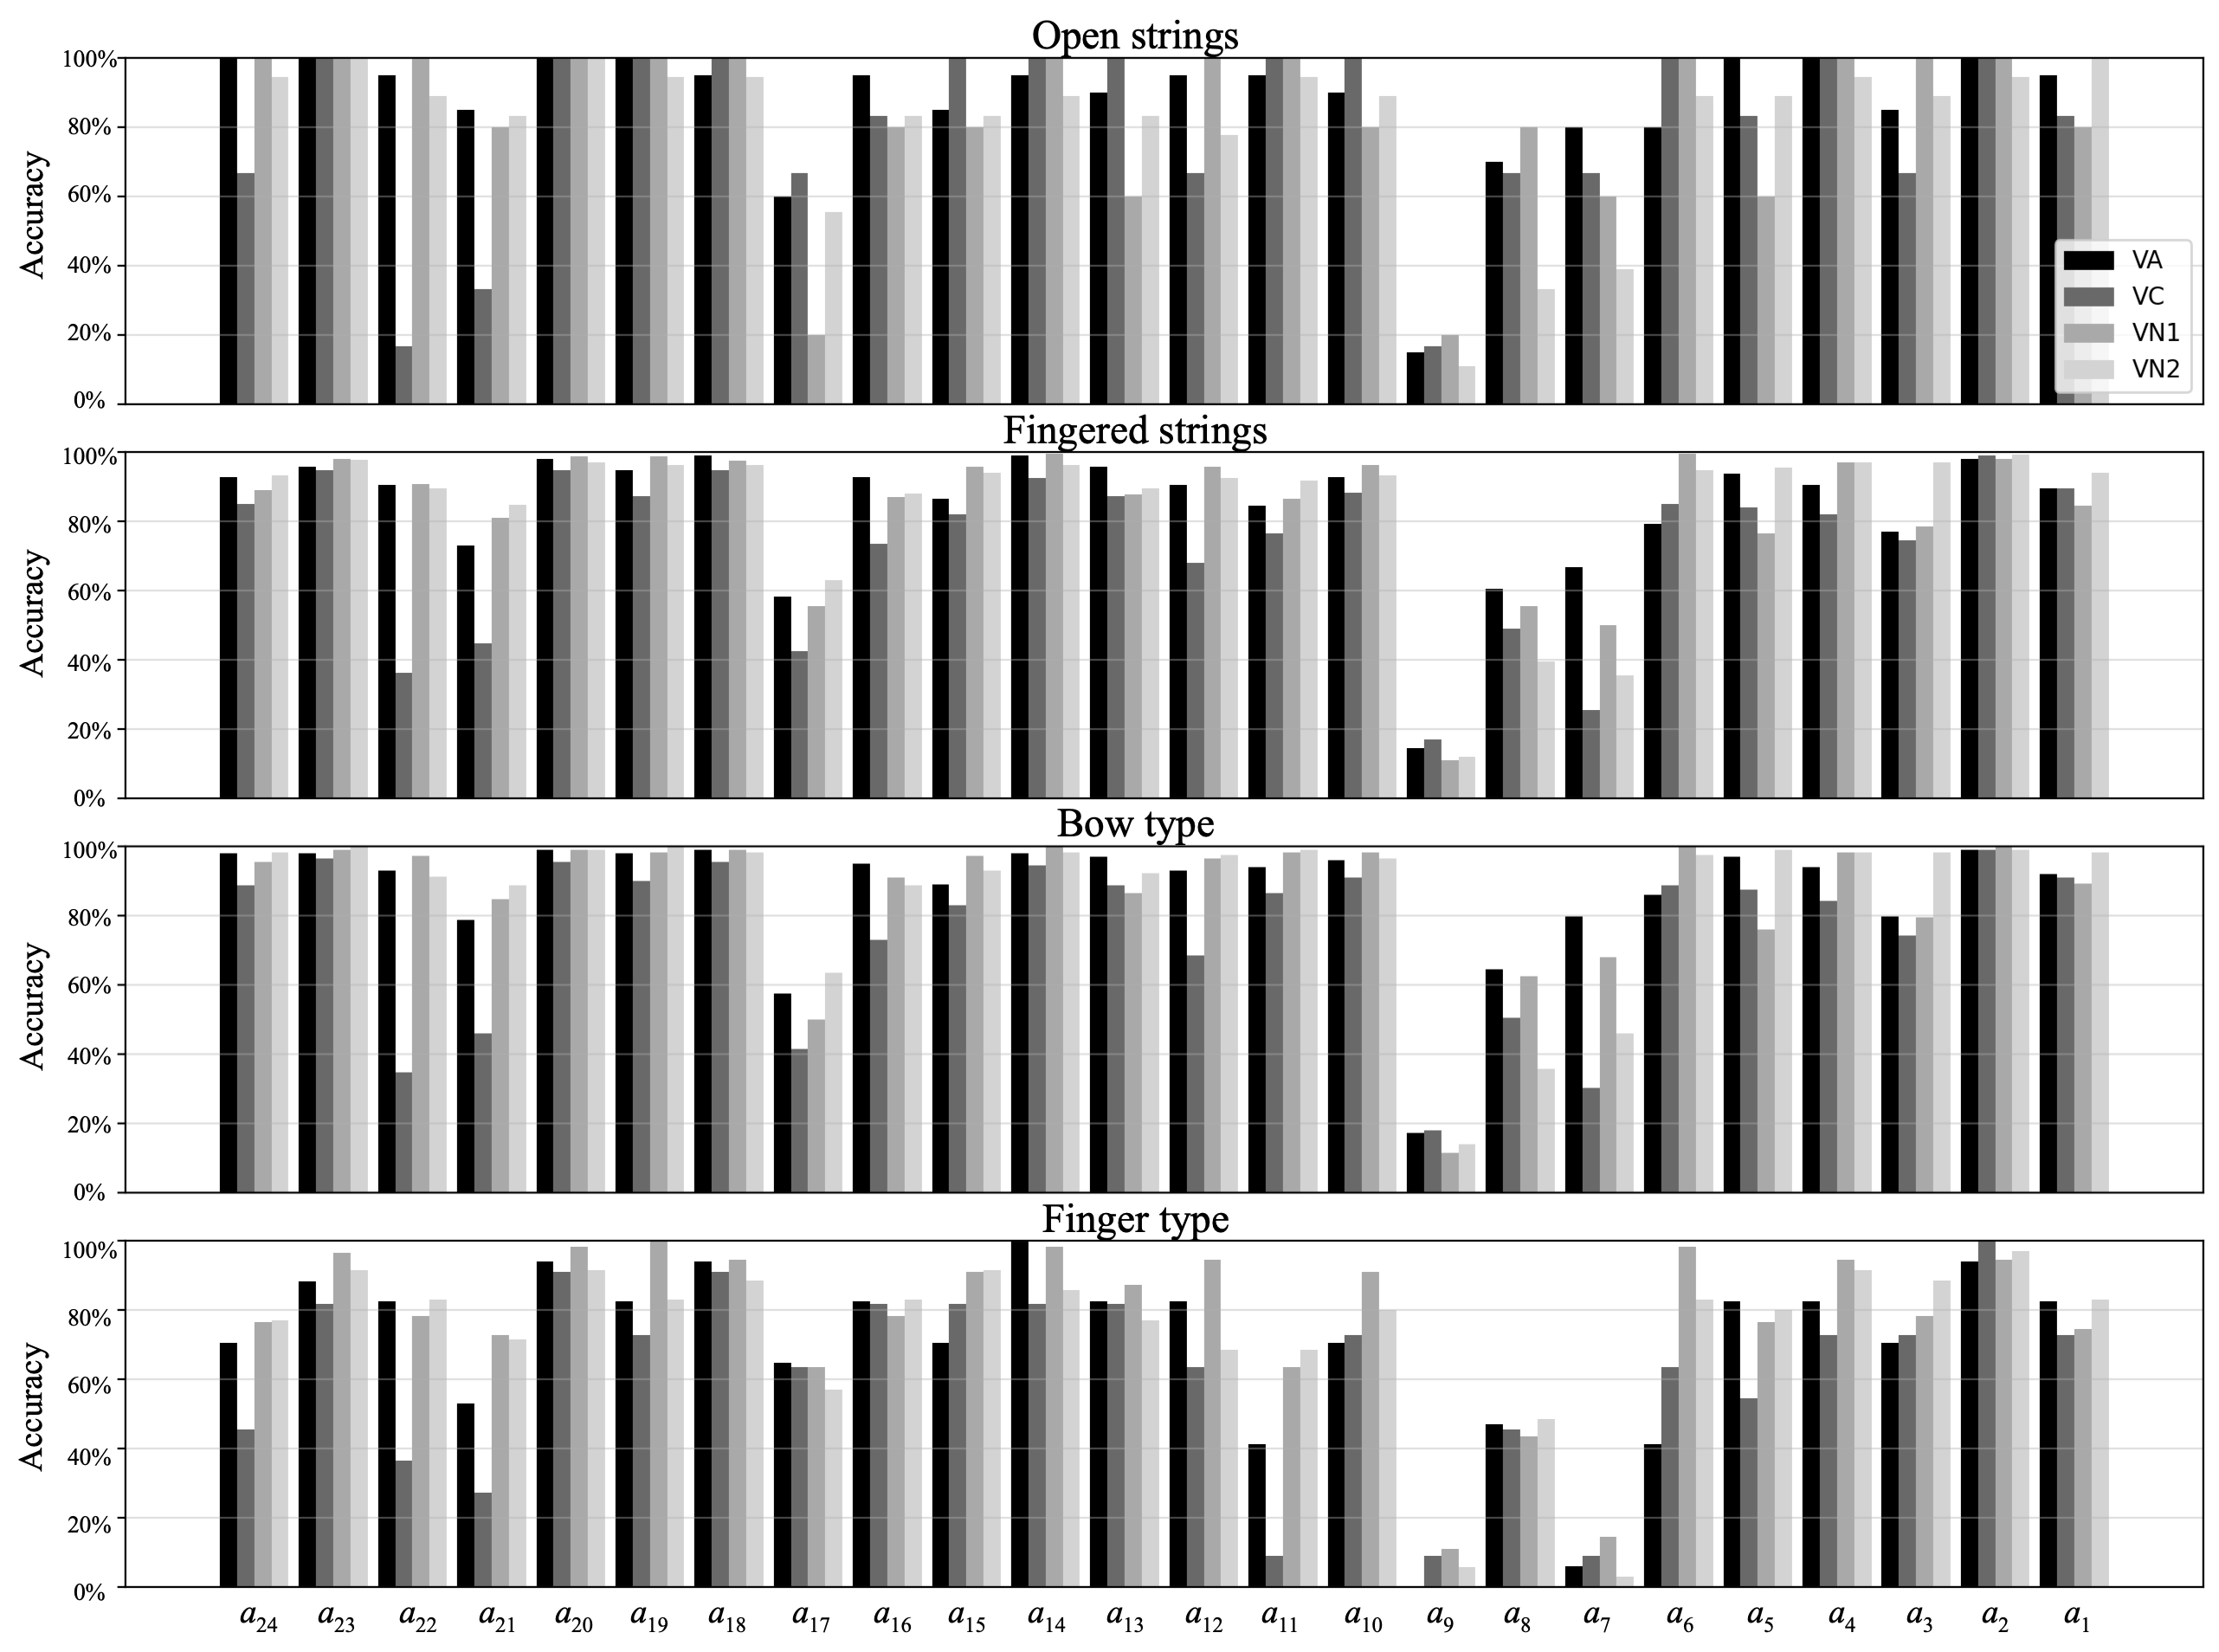
Figure 1. True positive rates per participant compared to ground truth expert annotations a_0 in NR12.
Figure 1 shows the performance of each annotator a calculated as percentage of TP onsets per instrument and onset category when compared to the expert annotations a_0 (i.e., here considered ground truth). The reported results use tolerance window size of 25 ms and are presented for every annotation participant. The highest mean accuracy of 98%, 97%, and 96% across onset types and instruments is observed in annotators a_2, a_20 and a_23, respectively. The lowest mean performance across onset types and instruments can be seen in annotators a_9, a_7 and a_16 with respective true positive rates of 12.8%, 42.5% and 55.2%. Additionally, means across onset types and annotators are 82.0%, 72.4%, 82.8% and 81.7% for VA, VC, VN1 and VN2, respectively.
Onset Detection Results For Each Instrument
For more details please refer to Experiment 3 in the paper.

Figure 2. Onset detection results as a correspondence between the onsets detected by the algorithms and compared against annotations from the annotators a_0, a_12, a_13, a_16, a_18.
Results are reported for five algorithms using annotations from NR, SP and DP conditions as well as, expert annotations a_0 from NR12. The overall highest performing algorithms for all instruments are CNN and CoF. The highest precision is achieved by CNN system (0.93) on the VN1 recordings with NR12 expert annotations. In the NR, SP and DP conditions the highest precision is achieved by the CNN (0.8), CoF (0.8), and CNN (0.83) algorithms in VN1, VN2 and VN1 instruments, respectively.
Onset Detection Results For Each Participant
For more details please refer to Experiment 3 in the paper.
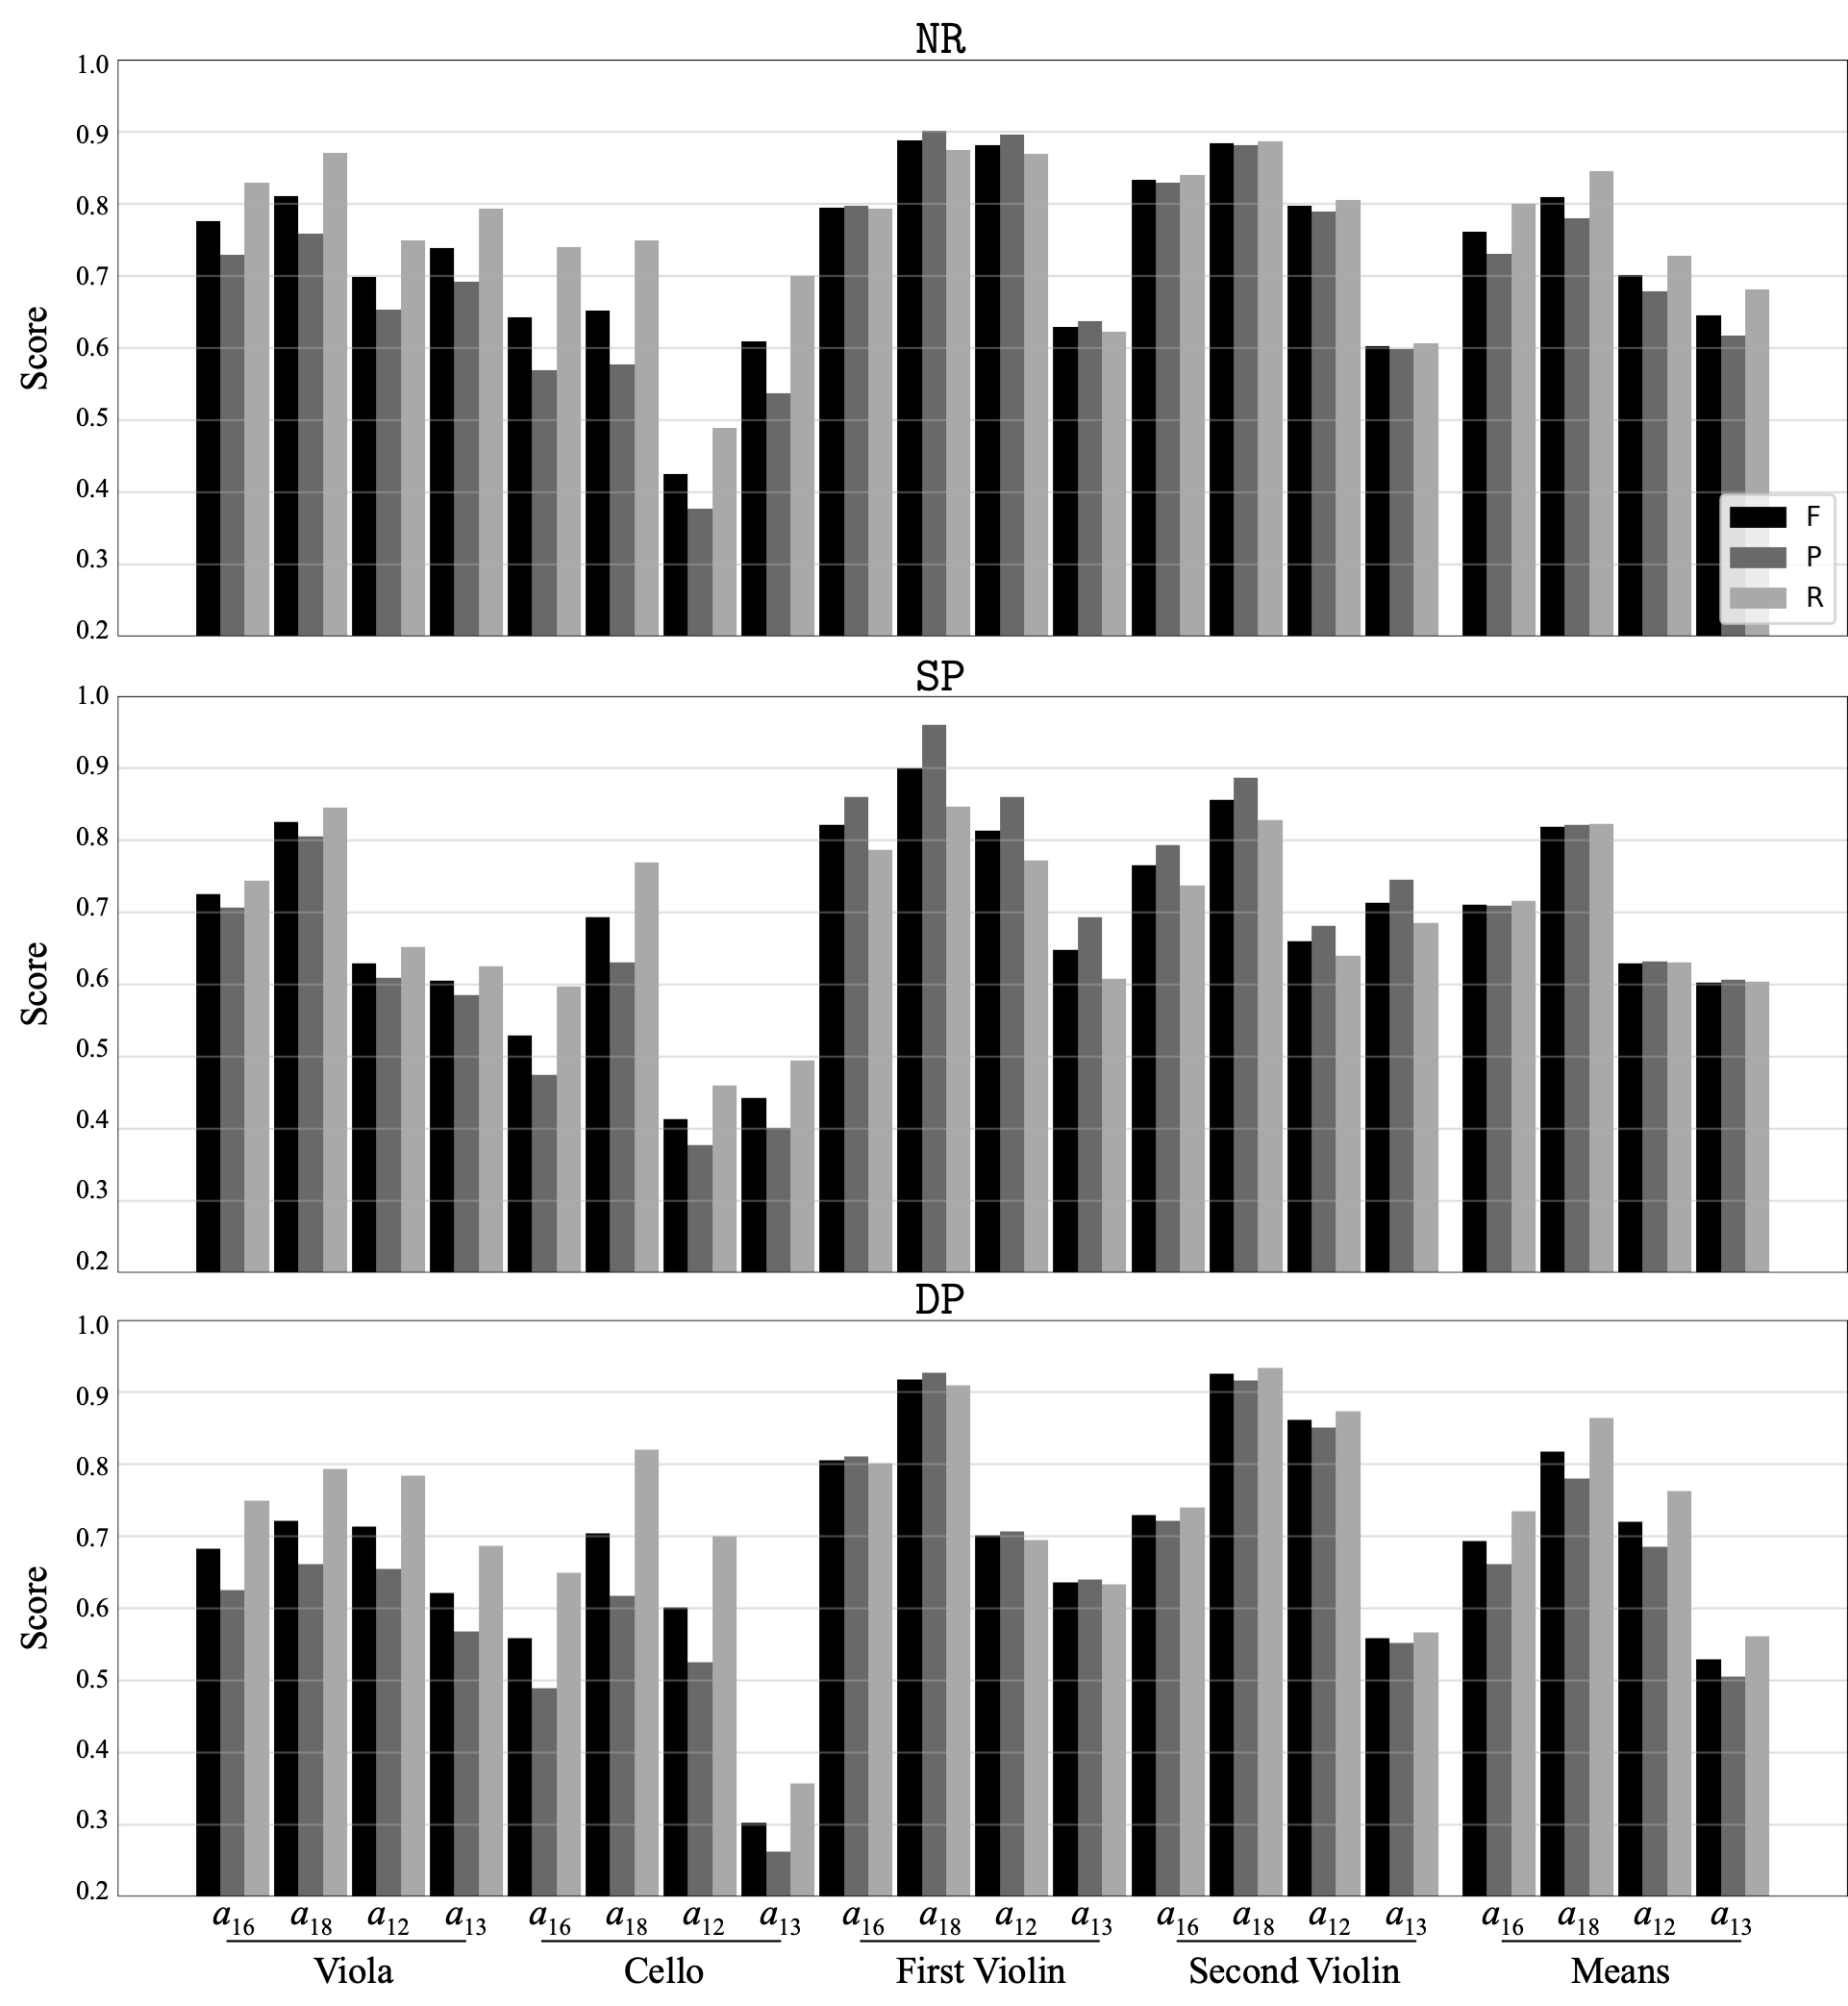
Figure 3. Mean F-measure, precision and recall for CNN method calculated for each annotator and instrument.
Figure 3 extends the per-instrument means plotted in Figure 7 in the paper.